Setting Up My VPS with Docker Compose and Traefik
This article likely contains outdated information, as it is around 3 years old.
The first few sections of this blog post explain my reasonings for obtaining a VPS and the logic behind my choice of AWS EC2. You can skip to where I start actually configuring the server.
Why obtain a VPS?
#As a web developer, I’ve been used to deploying my web apps on platforms like Vercel and Netlify. These platforms deploy your static pages and serverless functions, and I’ve generally went with serverless architectures instead of monoliths because of my experience with these platforms. They come with conveniences like GitHub integration, clear logging, and in general handle most of the inconveniences of maintaining infrastructure.
More and more, I found myself needing long running servers to deploy monolithic servers, cron jobs, or persistent databases. A plethora of hosting platforms exist to cater to this usage: Railway and Fly for servers; Upstash for Redis and queues; PlanetScale (MySQL), Supabase (PostgreSQL) and MongoDB Cloud (MongoDB) for databases.
These are all stellar services that provide a great experience, but the costs can be prohibitive. Very generous free tiers exist for most of them, but one you go beyond the basic usage into production applications with more users or simply want to host more services, the costs can add up tremendously.
For example, Fly provides “up to 3 shared-cpu-1x 256mb VMs and 3GB persistent volume storage (total)” on the free plan. This is far from enough for production workloads, and you still can’t do everything with the hardware you obtain – you have to configure your project for their proprietary configuration schema.
In addition, a lot of the cloud platforms had extraneous features that I didn’t need but kept paying for. For instance, with Supabase, I used none of its features except the built-in Postgres database. Although I appreciate the company for making the product open source, the costs of maintaining your own instance are still considerable, so in terms of affordability and convenience you are effectively locked in to their ecosystem if you use additional features such as Auth or Storage, unable to migrate without a hassle.
Therefore, I did some calculations, and decided to obtain my own virtual private server (VPS) to be able to host whatever I want on a cloud server with high network speeds and high availability.
AWS Elastic Cloud Compute
#Signing up for AWS was fairly straightforward, and I got to work setting up my first EC2 instance. Based on the recommendations of a friend and my own research, I decided to go with t4g.medium, a low cost, burstable general purpose instance type. I went with Arm mainly because of its lower costs (that would soon pose a few problems later on). 2 vCPUs and 4 GiB of memory I approximated to be enough for my hosting needs.
I setup the instance with Debian, a reliable operating system, and assigned to it an elastic IP.
Docker Compose
#I adopted Docker Compose to maintain the configurations for my server. A single-node Docker Swarm or Kubernetes cluster seemed to me rather overkill, so I just went with Docker Compose, which I had also worked with in the past durning an internship. Containerization with Docker provided convenience and modularity to the configuration of the server.
Traefik
#Note: Cloudflare stands in front of most of the services I am hosting on this server; reverse proxy here refers to the on-server reverse proxy handling routing and TLS.
There are many reverse proxies that I have come into contact with: good old NGINX, Caddy, Traefik, Reproxy, etc. I chose Traefik because of its deep integration with Docker, automatic TLS support, and general flexible configuration options.
I ran into multiple roadblocks configuring Traefik as it was my first time using it (or, indeed, anything beyond the simplicity that Caddy offered with its Caddyfile). I won’t tire you with the details of how I spent five hours getting it working with the help of winston and nyx, so here is how I got it working in the end:
Create a Docker network independent from Docker Compose for a shared network between Traefik and the services it’s proxying:
$ docker network create traefik_networkBind
traefik_networkas an external network to every service and Traefik itself via Docker Compose:services: demo_service: networks: - traefik_network - default networks: traefik_network: external: trueSet Traefik to use
traefik_networkas the network to use to connect to the services it’s proxying:[providers.docker] network = "traefik_network"
As to the configuration of Traefik itself, originally I used command line arguments, but it quickly got unwieldy so I moved it to a separate TOML file and used a volume ./traefik.toml:/etc/traefik/traefik.toml to expose it to Traefik.
The whole Traefik Docker Compose file:
services:
  traefik:
    container_name: traefik
    image: traefik:v3.0
    ports:
      - "80:80"
      - "443:443"
      - "5432:5432"
    volumes:
      - /var/run/docker.sock:/var/run/docker.sock
      - ./letsencrypt:/letsencrypt
      - ./traefik.toml:/etc/traefik/traefik.toml
    networks:
      - traefik_network

networks:
  traefik_network:
    external: true
I used the v3 beta instead of v2 stable here because of v3’s support for Postgres TLS, which I’ll touch on later. As you can see, the HTTP (80), HTTPS (443), and Postgres (5432) ports are bound to the host. The Docker socket, Let’s Encrypt storage directory, and TOML configuration are made available via volumes.
In the configuration, I configured the entrypoints mapping services to ports on the external Internet:
[entryPoints.web]
address = ":80"

[entryPoints.websecure]
address = ":443"

[entryPoints.postgres]
address = ":5432"
In order to utilize Let’s Encrypt and Traefik’s built in TLS support, I added a certificate resolver:
[certificatesResolvers.letsencrypt.acme]
email = "hello@example.com"
storage = "/letsencrypt/acme.json"

[certificatesResolvers.letsencrypt.acme.httpChallenge]
entryPoint = "web"
ACME here is configured to use the HTTP challenge for convenience.
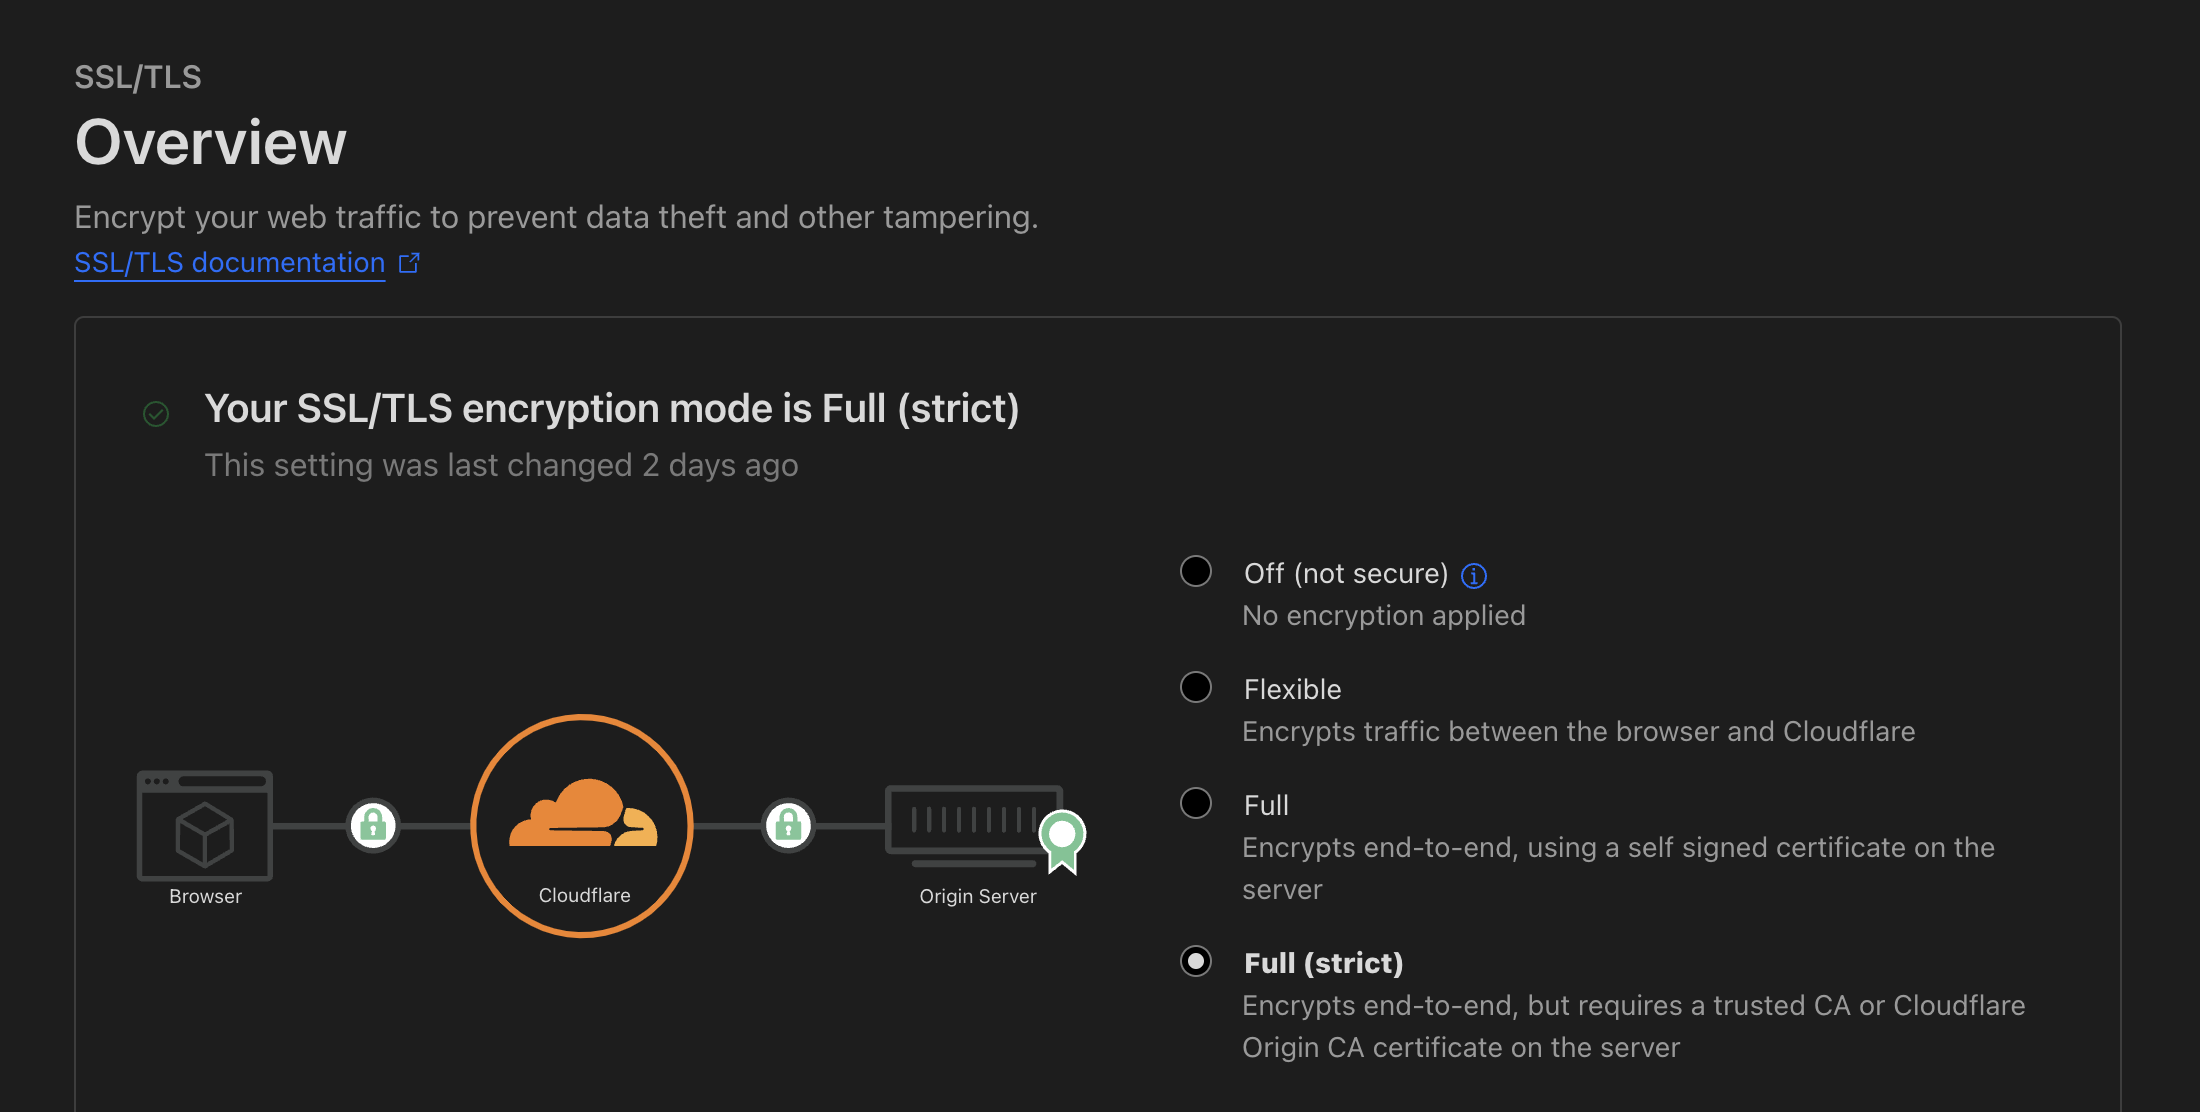
Originally, I had planned to use Cloudflare’s Origin CA certificates since I was planning on proxying mostly everything through Cloudflare, but it required a custom certificate authority to be installed into Traefik, couldn’t be accessed from anywhere other than Cloudflare, and didn’t work for services that weren’t proxied through Cloudflare (e.g. Postgres).
Watchtower
#Manually checking for updates to all the images that I’m using on the server could get annoying, especially as I’m still a student who doesn’t have that much spare time, so I decided to use Watchtower to automatically monitor and update my Docker images.
Setting it up in Docker Compose was straightfoward:
services:
  watchtower:
    container_name: watchtower
    image: containrrr/watchtower
    command:
      - "--interval=3600"
      - "--no-startup-message"
    volumes:
      - /var/run/docker.sock:/var/run/docker.sock
    env_file:
      - .env
    environment:
      - TZ=Asia/Shanghai
Here I configured it to refresh every hour instead of every day in order to get updates faster, and in .env I configured a Discord webhook so that I could see update logs and receive real time notifications without having to SSH into the server.
Services
#Miniflux
#Miniflux is a self-hosted minimal RSS reader that I use, mentioned in a previous post.
services:
  miniflux:
    image: miniflux/miniflux:latest
    depends_on:
      db:
        condition: service_healthy
    env_file:
      - .env.miniflux
    labels:
      - "traefik.enable=true"
      - "traefik.http.routers.miniflux.rule=Host(`miniflux.example.com`)"
      - "traefik.http.routers.miniflux.tls=true"
      - "traefik.http.routers.miniflux.service=miniflux-svc"
      - "traefik.http.services.miniflux-svc.loadbalancer.server.port=8080"
      - "traefik.http.routers.miniflux.tls.certresolver=letsencrypt"
    networks:
      - traefik_network
      - default
    restart: always

  db:
    image: postgres:15
    env_file:
      - .env.postgres
    volumes:
      - miniflux-db:/var/lib/postgresql/data
    healthcheck:
      test: ["CMD", "pg_isready", "-U", "miniflux"]
      interval: 10s
      start_period: 30s

volumes:
  miniflux-db:

networks:
  traefik_network:
    external: true
The Postgres database persists to a volume and has a health check that is linked to the Miniflux service. Migrating this from Fly (which I used previously to host my Miniflux) was more complicated, since I had to use pg_dump to dump the existing database and then restore the state of the database on the Docker Postgres database.
One thing I especially love about this setup is how the databases are never exposed to the public Internet; they are containerized and isolated within the default network of the Docker Compose project and never directly accessible from the Internet, only usable by their sibling services. This helps security.
SearXNG
#services:
searxng:
container_name: searxng
image: searxng/searxng:latest
networks:
- traefik_network
- default
volumes:
- ./searxng:/etc/searxng
env_file:
- .env
labels:
- "traefik.enable=true"
- "traefik.http.routers.searxng.rule=Host(`searxng.example.com`)"
- "traefik.http.routers.searxng.tls=true"
- "traefik.http.routers.searxng.service=searxng-svc"
- "traefik.http.services.searxng-svc.loadbalancer.server.port=8080"
- "traefik.http.routers.searxng.tls.certresolver=letsencrypt"
logging:
driver: "json-file"
options:
max-size: "1m"
max-file: "1"
restart: always
redis:
image: "redis:alpine"
command: redis-server --save "" --appendonly "no"
tmpfs:
- /var/lib/redis
restart: always
networks:
traefik_network:
external: trueHere, SearXNG uses the Redis database for simple rate limiting, so the data doesn’t necessarily need to be persisted; the ./searxng:/etc/searxng volume provides a basic configuration to SearXNG; and the .env configures an internal secret for the server.
Rather annoyingly, the official Docker Compose setup doesn’t actually work; its capability overrides for the SearXNG image
cap_drop:
  - ALL
cap_add:
  - CHOWN
  - SETGID
- SETUIDprevent it from automatically writing the mission-critical uwsgi.ini that uWSGI needs to initialize the server; therefore, the whole container fails on startup.
Umami
#Umami is a clean and fast self hosted analytics solution; Plausible, which I am currently using, is pretty expensive, so I was looking for an alternative.
Using the Docker Compose configuration in the repository, I was able to get it running:
services:
  umami:
    image: ghcr.io/umami-software/umami:postgresql-latest
    environment:
      DATABASE_URL: postgresql://umami:umami@db:5432/umami
      DATABASE_TYPE: postgresql
    labels:
      - "traefik.enable=true"
      - "traefik.http.routers.umami.rule=Host(`umami.example.com`)"
      - "traefik.http.routers.umami.tls=true"
      - "traefik.http.routers.umami.service=umami-svc"
      - "traefik.http.services.umami-svc.loadbalancer.server.port=3000"
      - "traefik.http.routers.umami.tls.certresolver=letsencrypt"
    depends_on:
      - db
    networks:
      - default
      - traefik_network
    restart: always
  db:
    image: postgres:15-alpine
    environment:
      POSTGRES_DB: umami
      POSTGRES_USER: umami
      POSTGRES_PASSWORD: umami
    volumes:
      - umami-db-data:/var/lib/postgresql/data
    restart: always

volumes:
  umami-db-data:

networks:
  traefik_network:
    external: true
However, I noticed that the server kept going down and returning Bad Gateway errors. I went into the container logs, and realized that it was constantly segfaulting. After doing some research, I found out that it an upstream bug with Prisma, the ORM that Umami was using under the hood to interface with PostgreSQL and MySQL, on aarch64 architectures.
Seeing that there were basically no solutions or fixes to the bug, I decided on a compromise: hosting the PostgreSQL database on my own server while hosting Umami’s Next.js app on Vercel. This way, I could also take advantage of Vercel’s CDN to make the Umami instance faster globally.
Umami: Postgres
#services:
db:
image: postgres:15-alpine
environment:
POSTGRES_DB: umami
POSTGRES_USER: umami
env_file:
- .env.postgres
volumes:
- umami-db-data:/var/lib/postgresql/data
labels:
- "traefik.enable=true"
- "traefik.tcp.routers.postgres.rule=HostSNI(`${POSTGRES_DOMAIN}`)"
- "traefik.tcp.routers.postgres.entryPoints=postgres"
- "traefik.tcp.routers.postgres.service=postgres"
- "traefik.tcp.routers.postgres.tls=true"
- "traefik.tcp.routers.postgres.tls.certresolver=letsencrypt"
- "traefik.tcp.services.postgres.loadbalancer.server.port=5432"
networks:
- default
- traefik_network
restart: always
volumes:
umami-db-data:
networks:
traefik_network:
external: trueI removed the Umami service and put POSTGRES_PASSWORD in an environment file since the database was now being exposed to the general Internet. The POSTGRES_DOMAIN is interpolated by Docker Compose from an .env file next to the YAML configuration file.
This is where Traefik v3 showed its usefulness: Postgres STARTTLS support was added to Traefik in v3, so by using Traefik v3 I was able to proxy Postgres through Traefik as well, allowing for multiple databases on different domains but one port through HostSNI matching and automatic TLS configuration, just like HTTPS, via Let’s Encrypt and ACME. This way, the traffic between the database and Vercel servers could be secured as well without too much complexity.
Monitoring
#After setting up so many services, I realized that I needed some sort of way to monitor the system status of my server so that I could take action when necessary and optimize which services I was running.
After some digging, I found a template called dockprom that included Prometheus, Grafana, cAdvisor, NodeExporter and alerting with AlertManager, with Caddy as a reverse proxy. Out of that template, I chose Grafana for visualization, Prometheus for the time-series database, cAdvisor for container monitoring, and Node Exporter for system metrics.
After some tweaking, I ended up with this Docker Compose setup that only exposes Grafana via Traefik to the public Internet:
services:
  prometheus:
    image: prom/prometheus:latest
    volumes:
      - ./prometheus.yml:/etc/prometheus/prometheus.yml
      - prometheus_data:/prometheus
    expose:
      - 9090
    command:
      - "--config.file=/etc/prometheus/prometheus.yml"
      - "--storage.tsdb.path=/prometheus"
      - "--storage.tsdb.retention.time=200h"
    restart: always

  cadvisor:
    image: gcr.io/cadvisor/cadvisor:v0.47.1
    volumes:
      - /:/rootfs:ro
      - /var/run:/var/run:ro
      - /sys:/sys:ro
      - /var/lib/docker/:/var/lib/docker:ro
      - /dev/disk/:/dev/disk:ro
      # - /sys/fs/cgroup:/sys/fs/cgroup:ro
    devices:
      - /dev/kmsg:/dev/kmsg
    expose:
      - 8080
    privileged: true
    restart: always

  nodeexporter:
    image: prom/node-exporter:latest
    volumes:
      - /proc:/host/proc:ro
      - /sys:/host/sys:ro
      - /:/rootfs:ro
    command:
      - "--path.procfs=/host/proc"
      - "--path.rootfs=/rootfs"
      - "--path.sysfs=/host/sys"
      - "--collector.filesystem.mount-points-exclude=^/(sys|proc|dev|host|etc)($$|/)"
    expose:
      - 9100
    restart: always

  grafana:
    image: grafana/grafana:latest
    volumes:
      - grafana_data:/var/lib/grafana
    env_file:
      - .env.grafana
    labels:
      - "traefik.enable=true"
      - "traefik.http.routers.grafana.rule=Host(`grafana.example.com`)"
      - "traefik.http.routers.grafana.tls=true"
      - "traefik.http.routers.grafana.service=grafana-svc"
      - "traefik.http.services.grafana-svc.loadbalancer.server.port=3000"
      - "traefik.http.routers.grafana.tls.certresolver=letsencrypt"
    networks:
      - traefik_network
      - default
    restart: always

networks:
  traefik_network:
    external: true

volumes:
  prometheus_data:
  grafana_data:
Prometheus communicates with Node Exporter and cAdvisor, and Grafana communicates with Prometheus. With this setup, I could look at fun graphs monitor my server and gain insight into performance metrics.
This was quite the learning experience for a web developer who had never done DevOps before, and honestly, I found it quite fun. I’d like to thank all the people who helped me set up things and found bugs in my configuration files full of flaws! I definitely will be hosting more and more stuff on the server in the days to come.